Sunday, July 27, 2014

Hannah Lyons - Week 4

This week, to practice for future SMURFing trips, we went to the aquarium and tested out our snorkeling skills. With the help of the lovely aquarium dive instructors we got all geared up in our wetsuit, hood, gloves, booties, fins and mask. We spent about 30 minutes in the Halibut Flats exhibit swimming with Canary Rockfish, Vermilion Rockfish, China Rockfish, Sturgeon, Halibut, Longnose skate, Cabezon, Lingcod and others. The aquarium staff asks that none of the visiting snorkelers reach out and touch the fish but some of the fish will come right up to you! The water was about 53 degrees Fahrenheit so we kept moving to keep warm and waved to the aquarium visitors in the underwater tunnels below. We made sure we could take our mask and fins off and back on safely while in the water to prepare for a possibly turbulent snorkel in the ocean. After the Halibut Flats we were able to go into a tank that is divided by a plexiglass wall from the shark exhibit. We clung to the wall and Leopard Sharks and Bat Rays nuzzled up against the glass as if they were curious about us! The Broadnose Sevengill Shark nicknamed "Ms. Piggy" because she is the largest at the aquarium, came by too. It was really an amazing experience to be so close to such beautiful animals.

I also was able to accompany our captain, Keith and two of the scuba diving team out on the Shearwater (the boat we use). They were diving down to retreive and replace a CTD device that is anchored to the ocean floor. The CTD measures conductivity, temperature and depth. It is an important tool in monitoring any changes in the water in or around the marine reserve. I was in charge of recording information about the dive and trip on our data sheets and running the computer software that "talks" to the CTD to begin taking samples and retreive data already taken.

It was yet another productive and fun week!
To designate the Shearwater as a research vessel while on the reserve.

Anchored, waiting for divers and watching the cormorants, pelicans and murres.
 

Peter Sheesley – Week 5, a visit to the Hatfield Marine Science Center


Week 5 was mostly spent counting phytoplankton from our water samples. We are almost through the 45 or so samples from July 17th and 18th and will need to go out for a new sample set this week. The new sites at Pack Trails and Shore Acres are exciting places to sample because of the high cliffs and necessity for a rope to assist descent at one point. Because several of the sites now require a very low tide, it will most likely be a two or three day project to get samples from all of the sites.

The highlight of the week was our trip up to the Hatfield Marine Science Center in Newport, Oregon. We heard about several of the projects the other COSEE PRIME students are working on, had a delicious Thai lunch, visited Otter Rock (where we saw whales), and heard a talk by Carmel Finley on some of the fishery history of the Pacific Northwest. Our evening ended with hamburgers and hotdogs from the grill of Itchung Cheung, who’s house has an amazing view of the coast at Newport. I’m looking forward to having the Hatfield group visit us here in Charleston this week.

A view from within the Devil's Punchbowl

Exploring at Otter Rock

The view at dinner

Tuesday, July 22, 2014

Week 4 at ODFW

The first thing that comes to mind when I think of the fourth week of my internship is, "where did my week go?" It flew by, and was packed with a variety of activities.

Starting backwards, yesterday I snorkeled in the Oregon Coast Aquarium's Halibut Flats tank in Passages of the Deep. Hannah Lyons and I quickly put on our wet-suits and snorkel gear; we proceeded to explore one of the most fascinating exhibits at the Aquarium. I paddled about like a child for a bit, before following around Sebastes pinniger and Sebastes miniatus.

After my snorkel experience at the Oregon Coast Aquarium 


Earlier in the week I was able to participate in a small discussion/training for a video analysis project going on at ODFW. The project itself is called Video Lander Analysis 2014, and it consists of habitat classification, species identification and meticulous counting. There is a rigorous cross-checking process, and 30 second "bins" where the maximum number of rock fish is recorded  within a single frame (29 frames per second). I was able to help explain how to use Adobe's Premiere to review videos, and share a few other handy bits of Premiere information. I've learned a lot since being at ODFW, and am happy to be passing some of my knowledge forward so quickly!

Two things I cannot go without during my day: coffee and a desktop. Here, I was editing a video which needed to be reviewed. 


On Friday I was able to help Marc (ODFW) over at HMSC with salmon tag scanning, and other data collection. Three other interns participated, and by the end of the two hours we were a well oiled data collecting machine! What is this information for? The IH unit at the Aquarium is housing several hundred diploid and diploid salmon, which are being used as controls for a large scaled data collection in the Willamette River. The information Marc and the small team of interns gathered is the first round of many for this project. Institutions such as the University of Washington, Oregon State University, the Hatfield Marine Science Center, the Oregon Coast Aquarium and ODFW are working  collaboratively on the project.

Sunday, July 20, 2014

Peter Sheesley – Weeks 3 & 4. Data Days, the Art of Plankton Counting, a Dead Whale, and a Pre-digital Oceanography Machine


In weeks three and four, I am now past the introductory and training phases of my summer and into the activity of data collection. This means both collecting water samples and counting the phytoplankton content of the samples. We have established our 15 sampling sites along the coast between Horsefall and South Cove, spread over a range of about 10 km of coast near Charleston, OR. The goal is to collect three samples at each site, within a 2-3 day period. These will make up a data set, and will probably be repeated two or three more times in the next four weeks. We’ll then be looking at how having a different surf-zone width (due to the angle of the ocean floor) impacts the presence of plankton.
Myself and Leyia collecting samples at Pack Trails. We have switched to casting the sampling tube with a fishing pole.
There are two phases of the project, going out to collect the samples, and analyzing the samples under the microscope. My estimate is that for each one day of collecting there are about four days of analysis. For each approximately 250 mL sample, I strain the sample to create a more dense sample, usually of about 25 mL. I then count the amount of five different types of plankton in a one-mL subsample. I can then extrapolate the amount of each type of plankton per one-Liter of the sampled water. To find the amount of plankton in the one mL on the Sedgewick-Rafter slide, I count circular frame-by frame in rows and columns. If one of the counts reaches 200 before making it through the slide, the frame number is noted and the amount per one-mL slide is extrapolated.

The types of phytoplankton I’m counting are Pseudonitszchia, Chaetoceros, Dinoflagellates, Navicula, and Asterionellopsis. Pseudonitszchia are of particular interest because they are toxic and cause some shellfish to be toxic to humans. Chaetoceros are generally the most abundant. Dinoflagellates have two flagella, one like a tail and another like a belt, and have been generally more rare. Navicula are boat shaped and also fairly rare. Asterionellopsis are a surf-zone species that are able to secrete a substance that moves them toward the beach during the day and then release the substance, moving them back down and out at night.

Straining a sample to make the plankton more dense per volume.

A stack of samples ready to be counted.  And a stack of containers from already counted samples behind those.

A page from my lab book. Each hash mark represents a single viewing frame counted under the microscope. There are five different samples/1 mL slides on this page.

A data sheet showing four samples, raw counts, and extrapolated per-Liter amounts.

During one of my days spent counting plankton at the microscope I began reflecting on just how accurate my counting method is, how much skill it takes (if any), and how often I’m making informed inferences about what I’m seeing. After all, the numbers of plankton per Liter can be over a million in some samples—and there’s no way my counting is so accurate that I’m getting the exact number over one-million in a one-Liter sample. In essence I’m arriving at an estimate of the amount. There are several other factors, besides sheer quantity, adding to the inaccuracy of my count. To begin with, I’m counting circular frames in a grid pattern, so there are areas in the corners being left out. To compound that problem the frame is advanced by hand-and-eye, leading to inevitable overlaps or jumps. Also the plankton are often in varying states of decay. I have an ideal form I’m looking for, and then I have to decide whether the organism is close enough to be considered for counting. Additionally I am looking from one angle at three-dimensional shapes. Sometimes chains are spiraling in ways that make counting an exact number of cells at that particular angle impossible. Then there is the factor of basic human error and fatigue. I’m counting many frames over periods of hours and trying to maintain focus regarding the presence of five different shapes and forms. Surely there will be errors. 

. . . and at this point in my reflections on the accuracy, skill, and decision making in counting, I begin to think that counting is in some ways an Art (that is Art with a capital “A” because it is the name of a specific type of discipline). I’m basing my thinking about Art in my years of being a professional Fine Artist, MFA in painting, and in several years of training in the martial arts. I think counting plankton is an Art because it involves pursuing an ideal (the perfect count) knowing full well you’ll not achieve that ideal. This is much like doing a form, or kata, in the martial arts. You do the same form over and over, each time striving to perfect it, knowing that perfection is impossible. Or it is like making a series of paintings, striving to communicate an idea, knowing that idea will never be perfectly communicated. And just as painting and the martial arts require discipline and endurance—so too does counting plankton. There are ups and downs in all of these practices; moments when the plankton is enchanting and wonderful to look at, and moments when it becomes boring and tiring. The practice of the Art means working through the lulls and cherishing the peaks. It means keeping in mind the big picture of what is being accomplished through the daily work.

In another way, I also began seeing each circle of light in the eyepiece as a work of art. The plankton made an unending variety of successful compositions. Some of them even reminded me of circular Chinese woodblock prints on parchment paper.
This one looks like a dragon fly landing on a tree branch in front of the moon.
This is "Plum Blossom Branch in Circular Fan Shape," an Illustration from the Ten Bamboo Studio Manual of Calligraphy and Painting (Shizhuzhai shuhua pu), after 1633 - before 1703, in the Harvard Museum.

Also, in week four, a juvenile humpback whale was found dead at Bastendorff Beach. I didn’t ever hear conclusively about why it died, but it did have many abrasions around one of its fins. Some of the local researchers cut samples from the animal. It was impressive to walk around the whale on the beach. Even just a young, small whale seemed huge. The skin was thick and rubbery. I was able to pry the eye open slightly and see how large the iris was. I can only imagine how different it would be to encounter this magnificent creature alive in the ocean. My imagination wanders, contemplating the depths it saw and the distances traveled.
Me and underside of whale's head.

View from the tail end.

One of the sample sections was removed here.

A view of the whale from the water.
Lastly, I’ve begun reading Sir Alister Hardy’s, The Open Sea, 1965. In some ways it is like an introductory manual to Oceanography. Although it is now outdated, it also provides an account of the science at a time when scientific instruments were more often hand-made, rather than purchased from a supply store. One of the instruments and its description was particularly interesting to me. In a time before digital electronic instruments, the ingenious contraption used marbles released at regular intervals into a compartmentalized disc, to determine the direction and prevalence of currents. The drawing and description of the Ekman Current Meter is below. (This is the same Ekman that Ekman Transport--a spiral pattern of movement in the water--is named after.)
Two consecutive pages from Hardy's book The Open Sea

Hannah Lyons - Week Three

This week I was able to take a few days off to climb Mt. St. Helens. 
In 1980 Mt. St. Helens erupted, blasting 3,000 ft off it's elevation and collapsing the north side of the mountain. 34 years later the volcano is still active and evidence of the blast is very much present. The trees are growing back and the streams are still finding new paths. 
We camped at the climbers bivouac at 3,700ft, on the southern side of the mountain and started our climb at dawn. The first two miles are through a dense coniferous forest with an elevation gain of 1,000 ft. Clearing the trees it opens up and the trail fades and the boulder fields start. We stopped a few times to snack on sardines and drank plenty of water. The last 100 feet is pumice and dust and with every step you sink back half a step. Although not a technical climb it is very strenuous. After five hours we reached the summit, the rim of the caldera. It was a clear beautiful day and from the top there were magnificent views all around. Mt. Rainier, Mt. Adams, Mt. Hood and Mt. Jefferson were all visible and majestic still covered in snow.

Panoramic view from the top. Mt. Rainier center, Mt. Adams right.

After enjoying the view and taking a rest it was time to descend. We were able to glissade (slide) most of the way down on the snow fields. We zoomed by the climbers that were still ascending and it only took two hours to get down. It was so fun!

Sliding down!

After ten miles, seven hours, 4,500 feet of elevation gained (then lost), I was exhausted and feeling so proud that I climbed my first mountain. It was great to come back to the cool and breezy coast for more video monitoring and invertebrate identification.

Me at 8,365 ft with Mt. Rainier in the background. 


Thursday, July 17, 2014

Jezzi Reynolds-Week 1


Hello,

 My name is Jezzi Reynolds. Recently I graduated from Olympic College with an Associate of Arts Degree. This was just a step towards my goal of working in a Marine Biology related field.

I plan to obtain a Bachelor’s degree with a major of Marine Biology. I have always been interested in marine life. I believe this comes primarily from growing up in Washington and next to Puget Sound (near Seattle).

My mentor is Kirstin Meyer. She is a PhD student in Dr. Craig Young’s lab at the Oregon Institute of Marine Biology (OIMB). She is writing her thesis on this project. The project that I am assisting on will study the settlement and development of hard-bottom communities. For everyone who doesn’t understand scientific terminology this means that we will be observing and analyzing the different kinds of marine life on the ocean floor.

We will be placing cement blocks attached to buoys on the ocean floor at different distances from the Simpson Reef off of Cape Arago. These blocks will have 6 inch by 6 inch plexiglass plates attached to them. A hole is drilled in the center of each plate. These are then placed on bolts protruding from the blocks. We will have 2 screws coming out of the side of each of the blocks 4 sides and 8 screws total per block. A rope is attached to the top of the block via an eyehole bolt on one end and tied to a buoy on the other.

We will have 5 sites for the blocks. We have 10 cement blocks and 2 will be placed at each site. To keep things organized we have labeled these from 1A to 5A and 1B to 5B. We will place 1A and 1B at the first site, 2A and 2B and so forth. We labeled the plexiglass plates with both letters and numbers. For example one of these plates read 1AS1. This means that it is in the first site and the first block in the site out of two (either A or B). The second half of this label is either an S for Short term or an L for Long term. If it is short term then we will leave the blocks out for about a week and collect those plates (replacing the block to the site). For long-term we leave them for about 2 weeks. The last number is the number of the plate on that block. There will be 4 S’s and 4 L’s per block (S1, S 2 etc. ). Two S’s will be on each of the North and South sides. The L’s will be done the same way but on the East and West sides.

The first week from the 23rd to the 27th we spent constructing the blocks and preparing and obtaining other materials that we need.
 
Top Photo: One of our cement blocks with the plates and rope attached. Ready to be dropped at the site.

Bottom Photo: Ashley (a student also helping Kirstin with the project) and my mentor, Kirstin.

Monday, July 14, 2014

Hannah Lyons Week 2

During our second week at Hatfield I learned how to score lander video. The lander is a device outfitted with a camera, used at Oregon Department of Fish and Wildlife and by many scientists, that is lowered to the bottom of the ocean where it stays stationary and records. It is a helpful tool for monitoring what is going on underwater in the reserve and outside in our control areas. Essentially "scoring" video is watching it and rating a number of factors. We look for view, visibility, relief of terrain, plant growth and density, and of course identify and count fish and invertebrates. The data scored from the recordings is useful in comparing the marine reserves and the still-fished control areas to determine what effects the "no take" policy of the reserves might be having on the marine ecosystem.

scoring lander footage
As with many scientific methods the lander could innately cause some bias in our data collection. Are some fish attracted or scared off by the lander? Is the lander being left down for a sufficient amount of time? Is the quality of footage or view limiting our identifications? When analyzing data the strength or weakness of an instrument or method needs to be understood and corrected for. To help understand the potential bias of the non-baited lander we all read a scientific paper comparing three methods of underwater data collection in temporal ocean, Detection of spatial variability in relative density of fishes: comparison of visual census, angling, and baited underwater video by Willis, Millar, Babcock 2000. We then discussed their findings and it helped us to tighten the protocols in our work.

I am very glad I had previous experience reading scientific papers in school. The group discussion was very beneficial in understanding the scientific process. The paper was usefulness in our field work and data analysis. Science is a wonderfully collaborative study and the peer review process helps to insure quality of others research that can help your own!

Leyia Johnson - Week Two

Hello All!

Pushkin
I have had so much fun this week! On both Tuesday and Wednesday morning, I finally got to don my rubber boots and go on an adventure. Alan drove Pushkin, Peter, and myself down to South Cove to go limpet tagging. This is the Northern most region that Lottia scabra, a species of limpet, live and there are only approximately two hundred Lottia scabra here; there are only approximately three hundred Lottia scabra in all of Cape Arago. On the California Coast you can find them clustered together, but this far North, since there are so few of them, they are more widely dispersed. Searching for the Lottia scabra was like the greatest I spy game or like a treasure hunt. We scrambled over rocks searching for the correct limpets. Lottia scabra are identifiable by their physical appearance and their distinctive behavior.

Tagged Lottia scabra
Lottia scabra look very similar to Lottia digitalis, a similar limpet, with shells that are mostly white and scalloped with ridges. However, Lottia scabra will have smaller ridges between the main ridges. Also, the apex, the radial center of their shells, will be pushed back about a quarter of the length of the animal. This is unlike Lottia digitalis whose apex is far forward. The juvenile Lottia scabra are a dark grey and bright cobalt blue. The juveniles also have little hooks trailing down their ridges. This makes them slightly simpler to identify than their tiny size would otherwise allow.

Lottia scabra home range:
Look closely,
you can see where the radula has
been scraping algae off of the rock.
Lottia scabra tend to prefer horizontal surfaces on large boulders; knowing this made them much easier to distinguish from the Lottia digitalis which preferred vertical surfaces. Lottia scabra, like other limpets, eat algae by slowly moving their heads back and forth and licking the algae off the rocks with their radula. A radula is a ribbon of tissue, similar to a tongue, that contains teeth. Lottia scabra also have a definitive home range. A home range is the area in which a limpet lives its adult life. Once attached to an appropriate surface, the limpet will remain in this small area for the rest of its life. During high tide, the limpet will move across the rock scraping algae off to eat. When the tide is low, the limpet has returned to its home scar. A home scar is the exact spot on the rock that the Lottia scabra returns to every low tide. If the limpet has been returning to its home scar for several years, (Lottia scabra can live to be thirty years old!), a depression in the rock can be seen around the limpet’s shell.  This depression is due to wave action eroding the rock around the limpet.

Me tagging a Lottia scabra
Once we found a Lottia scabra, Peter and I became very good at it by lunch of the first day, we would proceed to tag them. We accomplished this by mixing epoxy, placing a dab of the epoxy on the shell of the limpet, then, using forceps, taking a small plastic tag and placing it in the epoxy. Then, with a wet finger, so that the epoxy did not stick to our hands, we would smooth the tag into the epoxy and the epoxy over the shell so that wave action might not rip our tags off. If the tags stay on, we can learn more about Lottia scabra’s growth rate. If we can learn their growth rate, then we might be able to determine their longevity.

Friday, we did not spend any time in the lab considering it was the Fourth of July. Instead most people on campus went to the 4th of July picnic on Sunset Beach. The food was fantastic, the weather was warm, and the fireworks that night down on the boardwalk in Coos Bay were spectacular.

Happy Independence Day!

Sunday, July 13, 2014

Tabby Keefer's Third Week PRIME Experience

This week I indulged in a variety of things. One of my favorite activities consisted of learning how to use Adobe Premiere CS6 Pro. Not only did I learn the ropes of this program, but I was able to create a video editing (still images and video snippets) protocol. Another highlight of this week consisted of a group discussion on the scientific paper Detection of Spatial Variability in Relative Density of Fishes...This paper is a mirror project of what ODFW is trying to do with the data they've received, which I will talk about in this blog.


MARINE RESERVES FLICKR PAGE AND MY SMALL CONTRIBUTION

First of all, I would like to provide the link for the Oregon Marine Reserves Flickr page, <https://www.flickr.com/groups/oregonmarinereserves/>. This was created by my lovely mentor Stacy Galleher. My main focus this week has been more of a research task, I've been looking into a program Flickr partnered with called The Creative Commons (CC).

To make things simple, the CC is a company that rose in 2002 in order to make a shift  in the standard copyright movement. Basically any form of art (pictures, music, etc.) can be uploaded into this public domain; the material is free to anyone. The CC partnered up with Flickr a few years back, which allows Flickr users to upload images to the CC competitively. What I mean by this, is only the best images stay.

What does this has to do with ODFW and their Flickr page? Our goal is to promote positive marine reserve images as much as possible. Using CC is very tentative at this point, but it's something that needs to be looked into none the less. These processes are part of community engagement.

I captured this image from an under water video clip. This is an experimental lingcod meme that could be used as an outreach tool. Feedback would be greatly appreciated!


MY EXPERIENCE IN ADOBE PREMIERE AND VIDEO ANALYSIS

Why would I need to use Premiere? The answer is simple, it's an excellent tool to observe underwater data. This week I reviewed dozens of videos (with a variety of ODFW staff) from local areas such as Seal Rock and Alsea. One of the main goals for this data set is to eliminate counfounding factors, or biases in data.

To make things simple, I'm watching lander video drops with an average duration of fifteen minutes. Data analysis sheets are used when the videos are analyzed. These data sheets include: visibility (how well you can see underwater), view (the span of which you can see), rockfish species observed , certain invertebrate species, the time the lander lifts from the water and a few other details. If a video is too low of a quality, or the camera is tipped, the data cannot be used!

This is part of the "video cave" at ODFW's South Beach Annex. This is the area where I get to watch under water video while recording data on paper.


The ultimate point in this data collection is to determine fish behaviors around monitoring equipment. For example, we might determine that a canary rockfish only comes into view five minutes after the lander drops to the ocean floor. ODFW needs to analyze more data in order to reach a conclusion. Luckily, I get to be a part of this project!


Saturday, July 12, 2014

Peter Sheesley - Views Through the Microscope


A lot of my time has been spent learning to identify plankton through the microscopes. I've found I can get somewhat decent photos of what I'm seeing by holding my phone's camera up to the eyepiece. I'm posting these because I think the intricate forms are amazing, and to share what I've been seeing.

First, the phytoplankton (plants):

Protoperidinium

Asterionellopsis
Coscinodiscus
Ditylum
Dictyocha

Eucampia, Pseudonitzschia, Chaetoceros, Coscinodiscus, Probiscia
Skeletonema

Stephanopyxis

Odontella

Thalasionema (center)


Next, the zooplankton (animals):

Adult Copepod, side view

Adult Copepod, top view

Copepod Nauplius

Cypris Larva 

Rotifer

Another Rotifer
Shrimp Larva

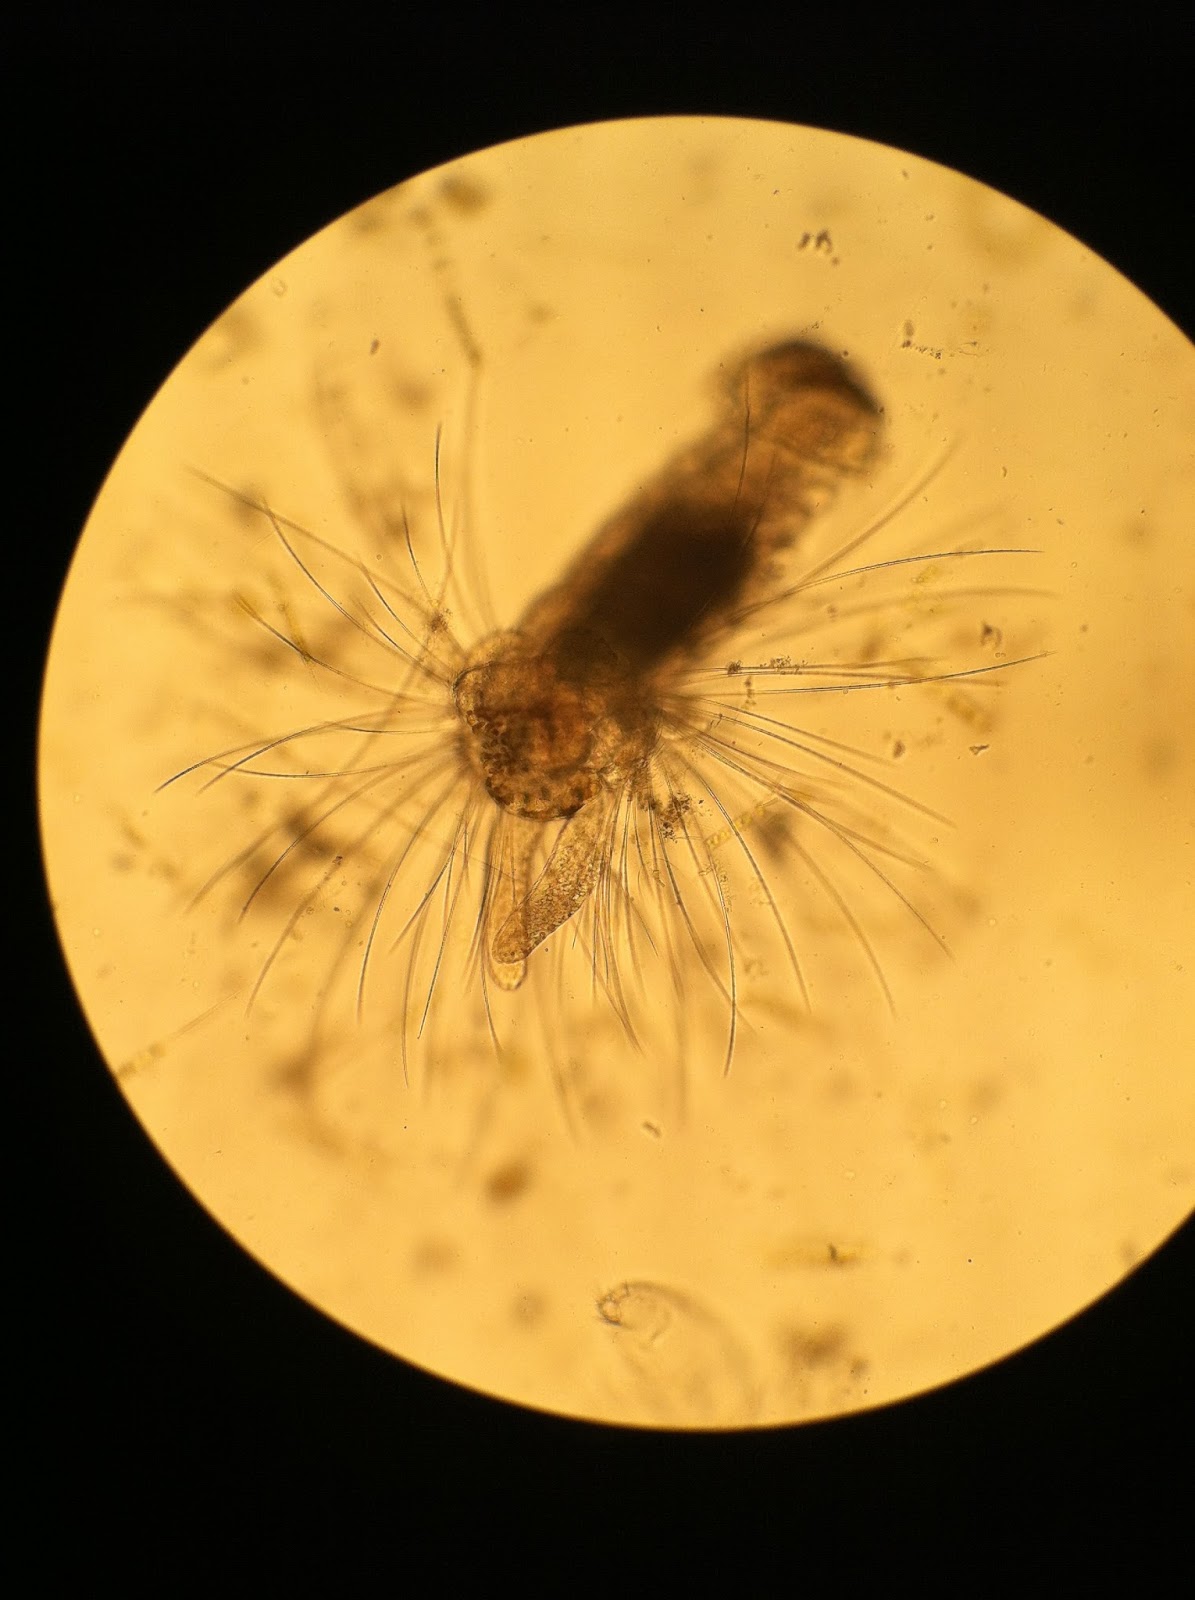
Polychaete

Barnacle Nauplius

Brachiolaria (second larval stage of sea star) amidst a lot of phytoplankton

Brachiolaria

Tintinnid


And, views of both zooplankton and phytoplankton from both dissecting scope and compound scope:


Cladocera, dissecting scope


Zoea, dissecting scope

Zoea, compound scope

Noctiluca scintillans

Noctiluca scintillans

Polychaete

Polychaete

Polychaete

Polychaete


And, some other interesting things:

Close-up of young jellyfish mouth

Close-up of young jellyfish tentacles
Ctenophore

A ctenophore's pharynx, stomach, and tentacle bases

A ctenophore's retracted tentacle

Finally, a few movies through the microscope:

Tracking a Dinoflagellate

The Undulations of a Polychaete

The Brachiolaria

The Living Sea, in the compound microscope

The Living Sea, in the dissecting microscope